Last Saturday was my first BarCamp experience and wow was it great! I love the unconference format where there is no pre-determined speaker schedule and attendees host/vote on sessions themselves. My first experience with this kind of conference was the digital analyst’s version of BarCamp, MeasureCamp, last year! I’ll admit that it just hit me while writing this post that BarCamp inspired MeasureCamp…
We Stand On Shoulders
Every once in a while, I pull back the curtain a bit to expose to others a little about our culture and values. I have never worked with a team that is so driven to read, share their knowledge, and continue to push each other, and themselves to grow. Our Slack channel is a gold mine of thoughtful selected skills, reading material, articles of interest, or anything that pushes our team harder. We do this for ourselves and because we feel like we can use this to help our clients.
Is it Possible to Segment Breast Cancer Diagnoses Based on Image Characteristics?
Have We Reached Peak Pumpkin Spice?
If we use data from Google Search trends, an excellent tool for evaluating the relative interest in a topic, then popularity in Pumpkin Spice Lattes reached its peak in September 2015. Subsequent years have seen a slowdown in searches for the Fall delicacy, and 2019 marked the lowest interest since that peak in 2015.
How (Emotionally) Similar are Emmy Nominated TV Shows?
This past weekend, this small thing called the “Emmy Awards” happened. Many people care a lot about this. Those people definitely had an opinion about Game of Thrones. Meanwhile, I apparently don’t watch any worthwhile television because I have watched exactly zero of the shows that were nominated for the two biggest awards — Outstanding Comedy Series and Outstanding Drama Series.
Enrich Your Data: Build Your Own Dataset Through Web Scraping and Other Sources
Current and Future State of Recommender Systems
In this day and age, we have so many choices when it comes to making online purchases, watching a TV show or movie using a video streaming service, or finding songs to listen to online. Given the plethora of choices, companies need some way of curating content for customers, since browsing through millions of products on a website is just not feasible.
Who Would Win if Google Search Volume Decided 2019 Emmy Winners?
Google Trends is an awesome data source for comparing general interest in specific search queries or topics. This data can give us a sense of how popular a given topic is at a moment in time. For this analysis, we compared 2019 Emmy Nominations in each category to see how they would perform if Google Search volume decided the winner.
3 Ways I Learned Through My CompassRed Internship
Have you ever been shopping on Amazon.com and wondered why certain ads pop up on your screen? Or maybe you’ve been curious about the polling results in the upcoming election. These two examples highlight how pervasive data is in everyday lives. It is incredibly powerful and influential; yet, sifting through and making sense of it can turn into an arduous task. My internship at CompassRed focused on learning the art of data storytelling, an increasingly valuable skill that pairs a powerful narrative with clear visualizations in order to draw larger conclusions and insights from complex questions.
Top 3 Ways Organizations are Leveraging Facial Recognition
Face detection/recognition has been a growing field for the last few years. With advancements in computer vision, companies have been able to leverage powerful algorithms to help solve a variety of problems. However, there have been debates about the balance between benefit to society vs the cost of people’s privacy.
Here are a few ways that organizations are using face detection.
Makeover Monday: Visualizing the Emoji Mashup Twitter Bot
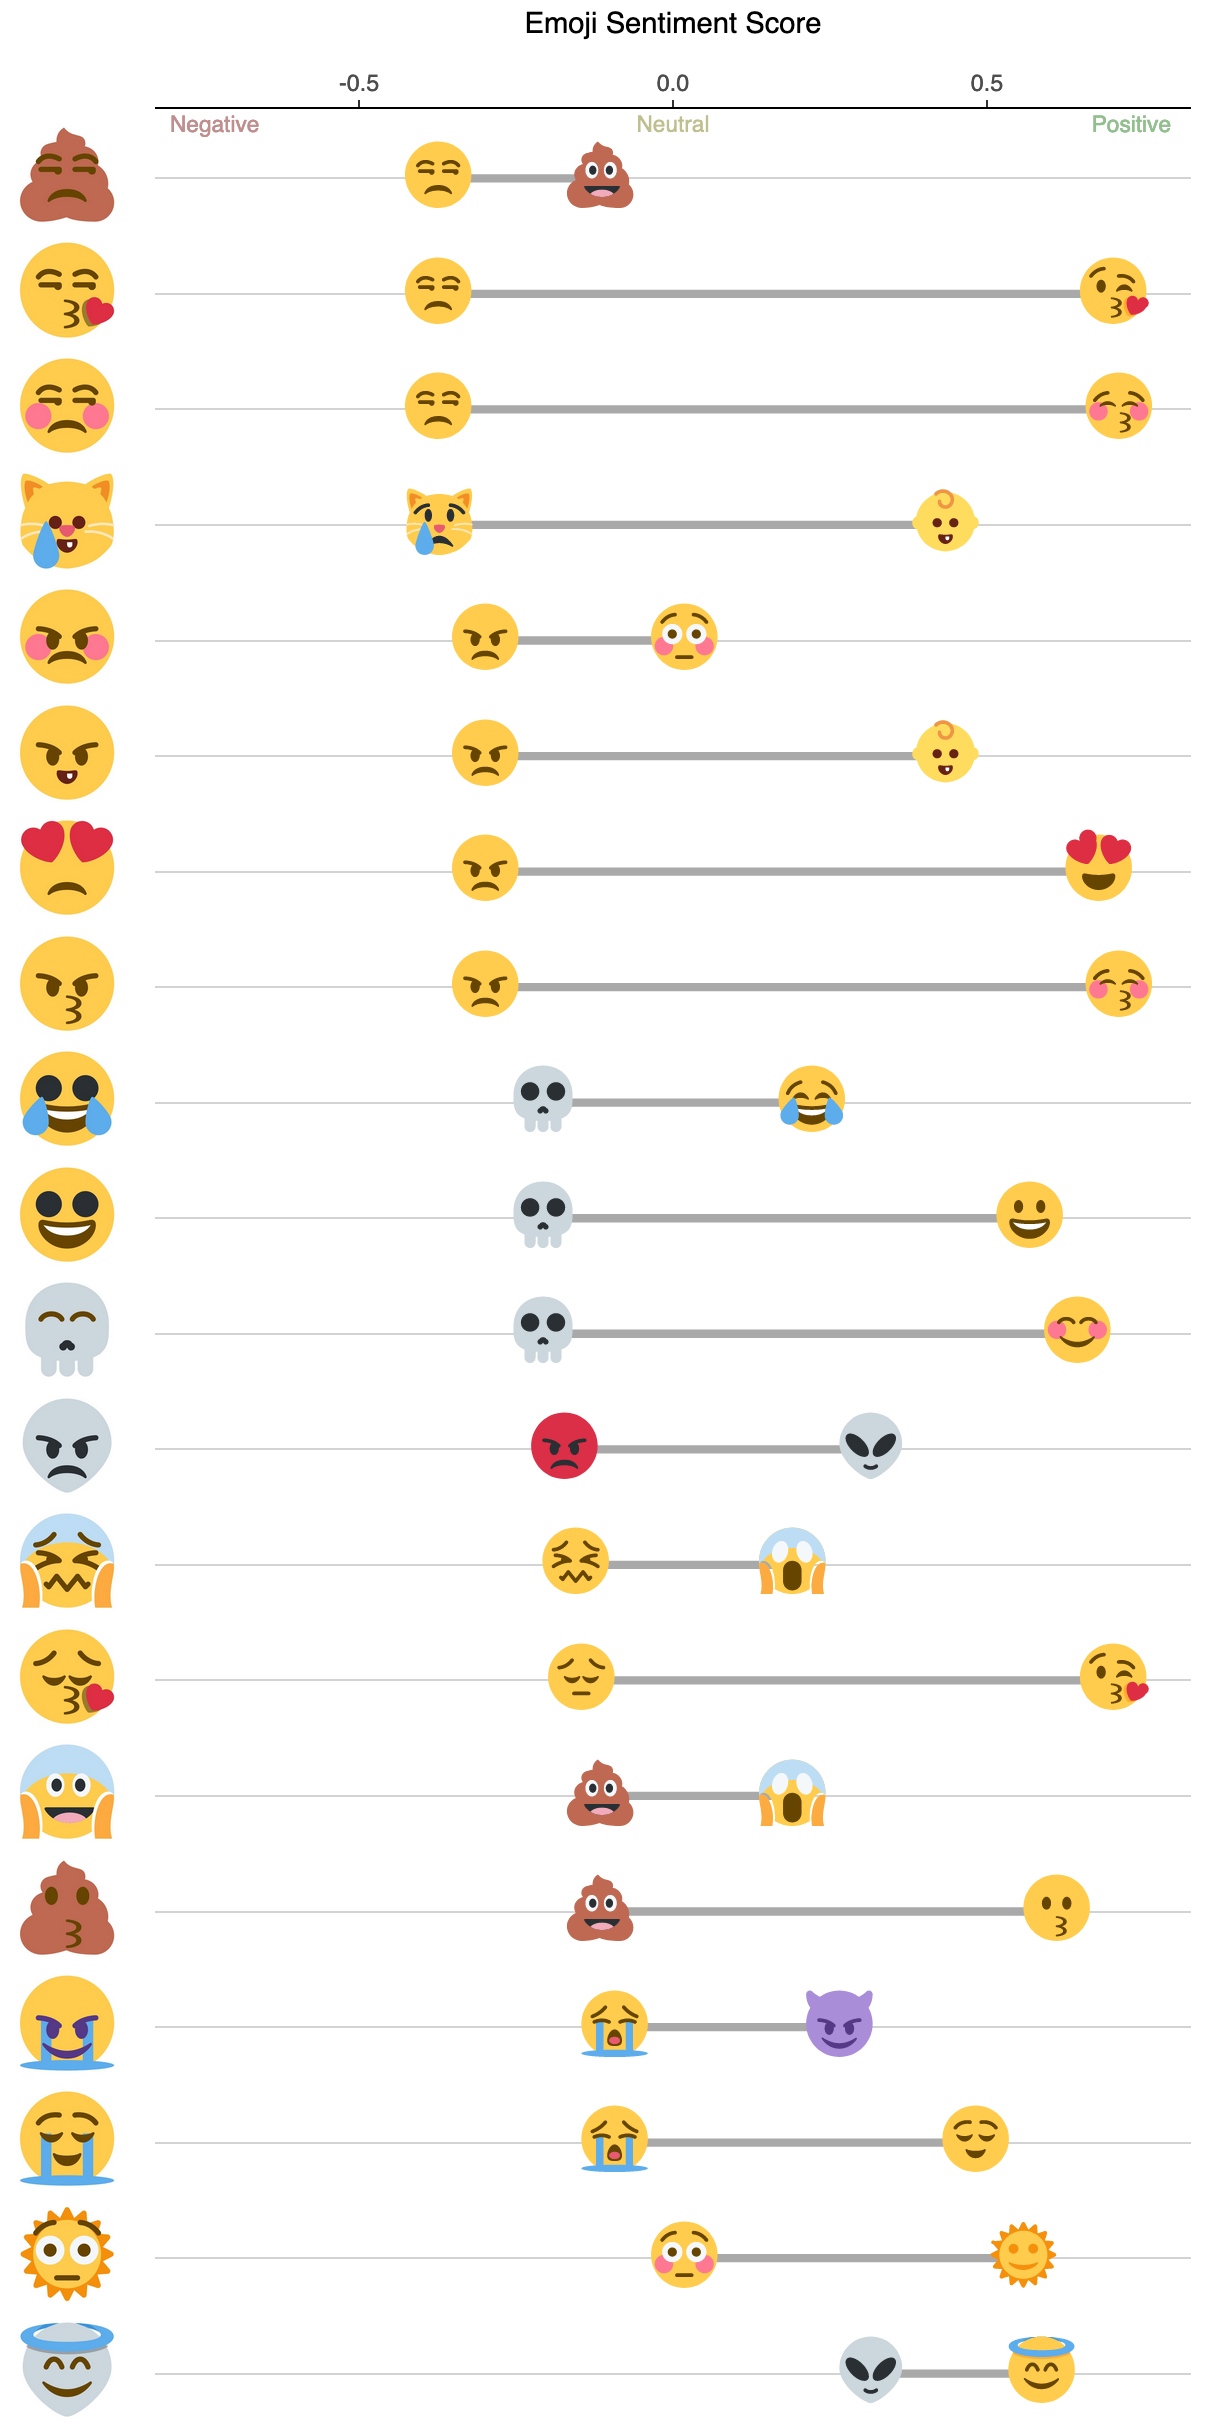
For this week's Makeover Monday data visualization exercise, I downloaded tweets from the increasingly popular Emoji Mashup Bot. This Twitter bot takes two emojis and creates a mashup between the two every hour. The author, Louan Bengmah, uses the Processing programming language to extract features from each emoji and combine them to create emoji "mashups".
YouTube Channels We Love
Can Michael Scott be recreated with AI?
What Comes After Google Analytics?
If you work for an organization that has any kind of online presence, chances are that you have Google Analytics (GA) set up on your website.
We’re one of Delaware’s Fastest 50
GDPR, Data Privacy, and Your Next Big Lawsuit
5 Things I Learned at This Year’s 2019 Philadelphia Data Jawn
Three years ago, when I sat down with Joey Davidson and Dan Larson to dust off the concept of “The Philadelphia Data Jawn”, I had three goals in mind: Learn, even if we were the only ones to show up, mix with some of the smart people in the Philadelphia community to hear what others were working on, and help build the community of Data Analysts and Data Scientists in the region.
Tweet to the Rhythm: What Twitter Tells Us About Music Festivals
For 3 days each year, Dover welcomes the Firefly Festival and thousands of people with it. At CompassRed, we love how many people come and celebrate in our home state with us. In honor of that, we took a look at the Twitter timelines of 15 of the top music festivals in the world for 2019¹ — including our very own Firefly.
Analytics Maturity Models: A Core Component Of Analytics Strategy And How To Better Understand Your Current State
What Are Classification Metrics?
So, you have your first interview for your dream data science job. You begin chatting with the interviewer, and ace all of the behavioral questions. What’s your greatest strength? Your greatest weakness? You already know these answers because they’re the same answers you have given in countless other interviews…


