

This past weekend, this small thing called the “Emmy Awards” happened. Many people care a lot about this. Those people definitely had an opinion about Game of Thrones. Meanwhile, I apparently don’t watch any worthwhile television because I have watched exactly zero of the shows that were nominated for the two biggest awards — Outstanding Comedy Series and Outstanding Drama Series. In case you’re like me and also haven’t watched any of those shows, here were the nominees:
Outstanding Comedy Series
Barry (HBO)
Fleabag (Prime Video)
The Good Place (NBC)
The Marvelous Mrs. Maisel (Prime Video)
Russian Doll (Netflix)
Schitt’s Creek (Pop TV)
Veep (HBO)
Outstanding Drama Series
Better Call Saul (AMC)
Bodyguard (Netflix)
Game of Thrones (HBO)
Killing Eve (BBC America)
Ozark (Netflix)
Pose (FX)
Succession (HBO)
This is Us (NBC)
Spoiler alert: the winners were Fleabag and Game of Thrones.
As a person whose head is in the sand regarding television and as a person whose worldview is largely defined by data, I was curious to see what the shows might be like. For that, I turned to a technique called “sentiment analysis”.
If you’re unfamiliar with the technique, sentiment analysis is a subset of natural language processing that attempts to understand the emotions of text. In its most basic form, that means understanding how positive or negative the text is. In a more complicated form, we try to discern the emotions behind the text. To do this, words are compiled into a “lexicon” and then emotional associations with each word are crowdsourced.
TV shows are more complicated than how positive or negative they are, so I chose to look at the nominated shows through the lens of emotions. Here are the emotions that we can compare our text to given our selected lexicon:
Anger
Anticipation
Disgust
Fear
Joy
Sadness
Surprise
Trust
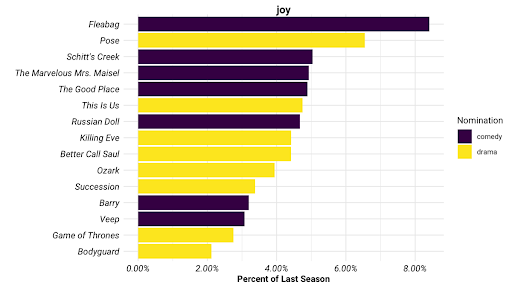
Let’s take a look at the average percent of words for each emotion for the most recent season of each show:

To interpret this, you could say that “approximately 5% of words from Veep are focused on trust” or that “approximately 8% of words from Fleabag are focused on joy”. It’s also worth mentioning that one word can be associated with multiple emotions or not be associated with an emotion at all. For this reason, it’s okay that our categories do not add up to 100% for any given show.
We gain more insight when we layer in how each emotion ranks within each show:

The emotion that makes up the highest percentage of words for Fleabag is joy (second most is trust, third most is anticipation, and so on). On the other hand, the emotion that makes up the highest percentage of words for Game of Thrones is trust.
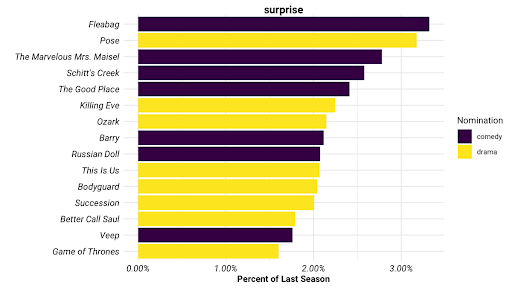
We can also see which shows rank highest within each emotion. Some emotions lend themselves more to dramas. Others lend themselves more to comedies. Others lie somewhere in-between.
Trust, anger, and fear tend to be more associated with the dramas whereas joy, surprise, and anticipation tend to be more associated with the comedies. Sadness and disgust seem to fall somewhere in the middle.


Seeing this view leads us to ask the question, “which shows have the most similar emotions to each other?” One way that we could answer that is through a technique called “hierarchical clustering”. This allows us to directly compare the average emotions of shows against each other.

Similarity calculated using Euclidean distance. Clusters linked using Ward’s method.
Shows that are directly linked to each other have the most similar emotional makeup. For example, The Marvelous Mrs. Maisel has similar average emotions to Schitt’s Creek. Considering that they are both comedies, this makes perfect sense.
Similarly, Game of Thrones is extremely similar to Bodyguard. Once again, considering that these two are both dramas, this also makes sense.
However, when we look at our other winner, Fleabag, it is most closely related to Pose. One is a comedy and the other is a drama, yet from an emotional perspective they appear to be very similar.
This makes sense, considering that there is a whole sub-genre called “dramedy”, which combines elements of both comedy and drama. It begs the question — how thin is the line between a comedy and a drama. Even further — can we quantify that difference? In a future analysis, it may be possible to find the transcripts of every Outstanding Comedy Series and Outstanding Drama Series nominee in order to quantify this difference, but for now, we’ll have to settle for knowing that the emotional line between the two categories is thin.
CompassRed is a full-service data agency that specializes in providing data strategy for clients across multiple industries.